CEDAR CITY MARKET UPDATE
Cedar City had 338 homes for sale at the end of September 2026. In October 2023 it had 172. That is up 97% in three years, close to double.
Most of that growth happened in 2024 and 2025. Compared with September 2025, inventory is up about 5%. This year it has mostly leveled off.
This post walks through 36 months of city-level numbers from the Redfin Data Center: homes for sale, new listings, sales, months of supply, median price and days on market. What the numbers show comes first. What I think they mean comes after, labeled as my read.
The short version
- Homes for sale: 172 (Oct 2023) to 338 (Sep 2026), up 97%. Up 5% from Sep 2025 (321) and up 33% from Sep 2024 (255).
- Listings vs. sales: 3,038 new listings and 2,104 sales over the 36 months. About 69 sales for every 100 new listings.
- Months of supply: 2.9 (Oct 2023) to 5.4 (Sep 2026).
- Median sale price: $339,990 (Aug-Oct 2023) to $388,065 (Jul-Sep 2026).
- Median days on market: 40 (Aug-Oct 2023) to 64 (Jul-Sep 2026).
1. Homes for sale, month by month
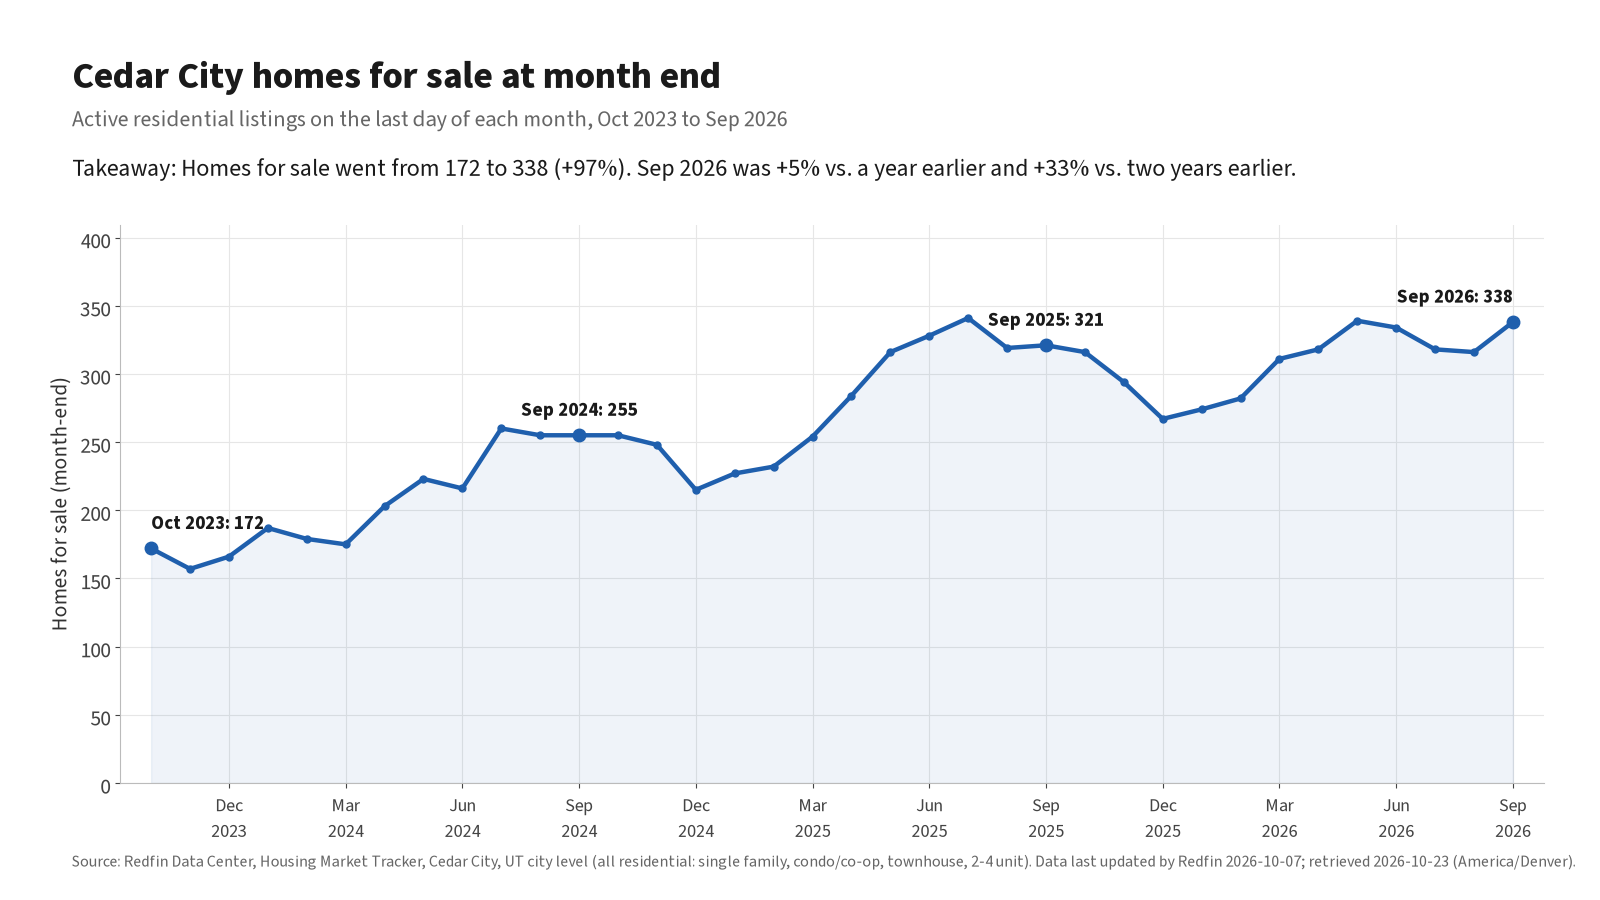
Homes for sale on the last day of each month, Cedar City, Oct 2023 to Sep 2026. Source: Redfin Data Center. Takeaway: inventory climbed through 2024 and 2025 and has moved in a narrower range in 2026.
What the numbers show: the low point was 157 homes in November 2023. The high point was 341 in July 2025. September 2026 landed at 338, near that high.
2. Same month, different year
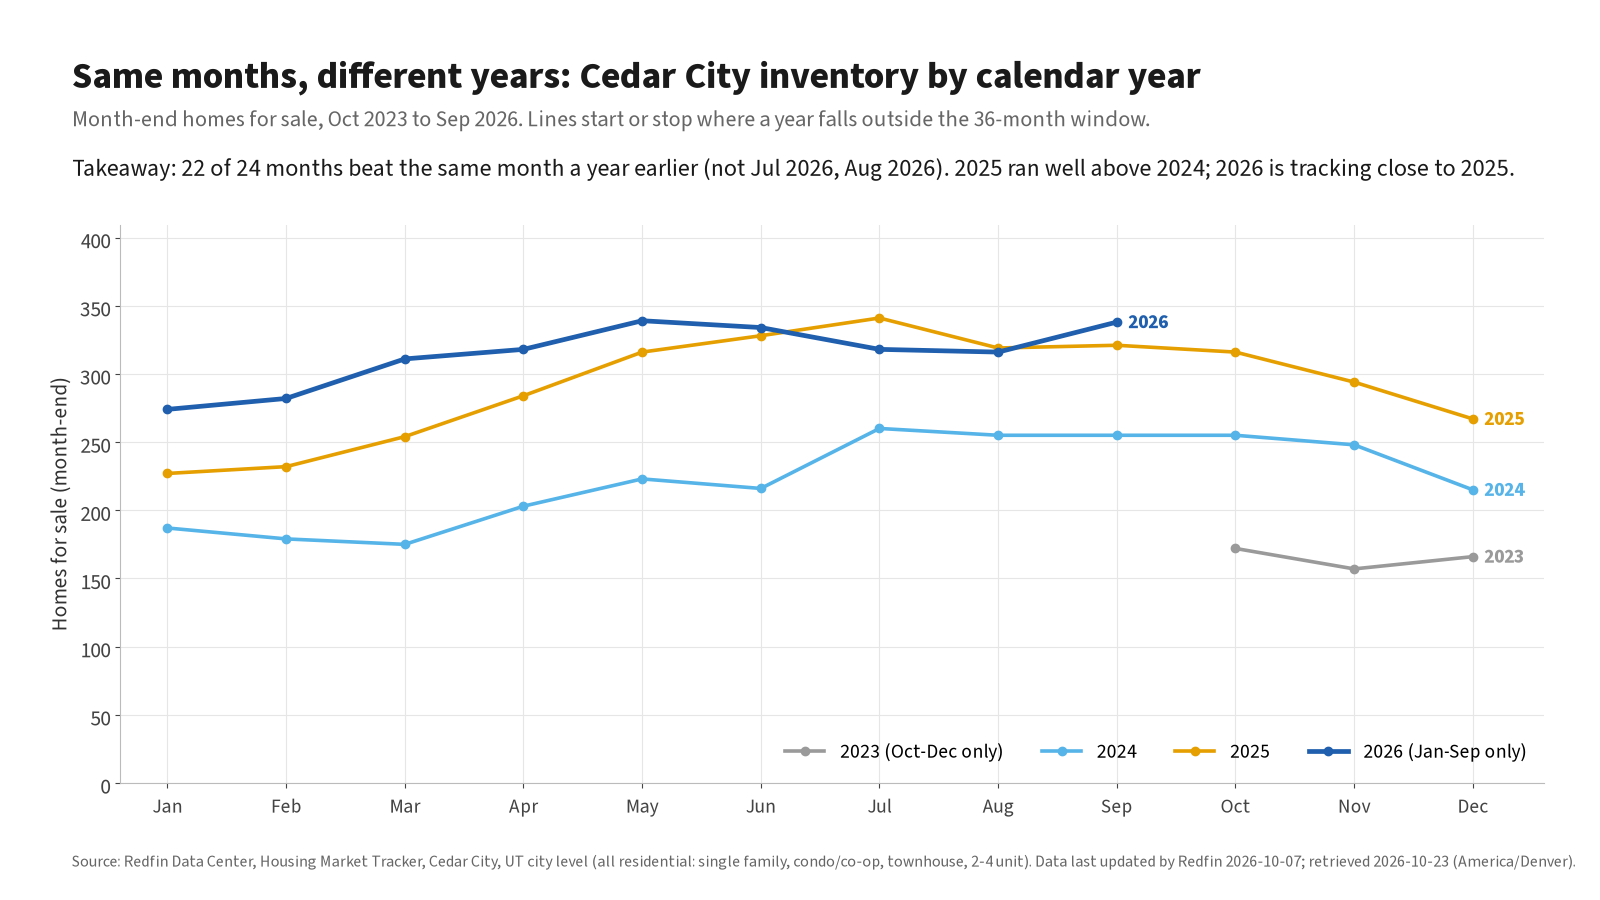
Month-end homes for sale by calendar year, Cedar City, Oct 2023 to Sep 2026. Source: Redfin Data Center. Takeaway: 2025 ran well above 2024, and 2026 is tracking close to 2025.
What the numbers show: in 22 of the last 24 months, inventory was higher than the same month a year earlier. The two exceptions were July 2026 (318 vs. 341) and August 2026 (316 vs. 319).
Cedar City inventory also has a season. It tends to build in spring and early summer and ease off in late fall and winter. Comparing the same month across years takes that pattern out of the picture.
3. New listings vs. homes sold
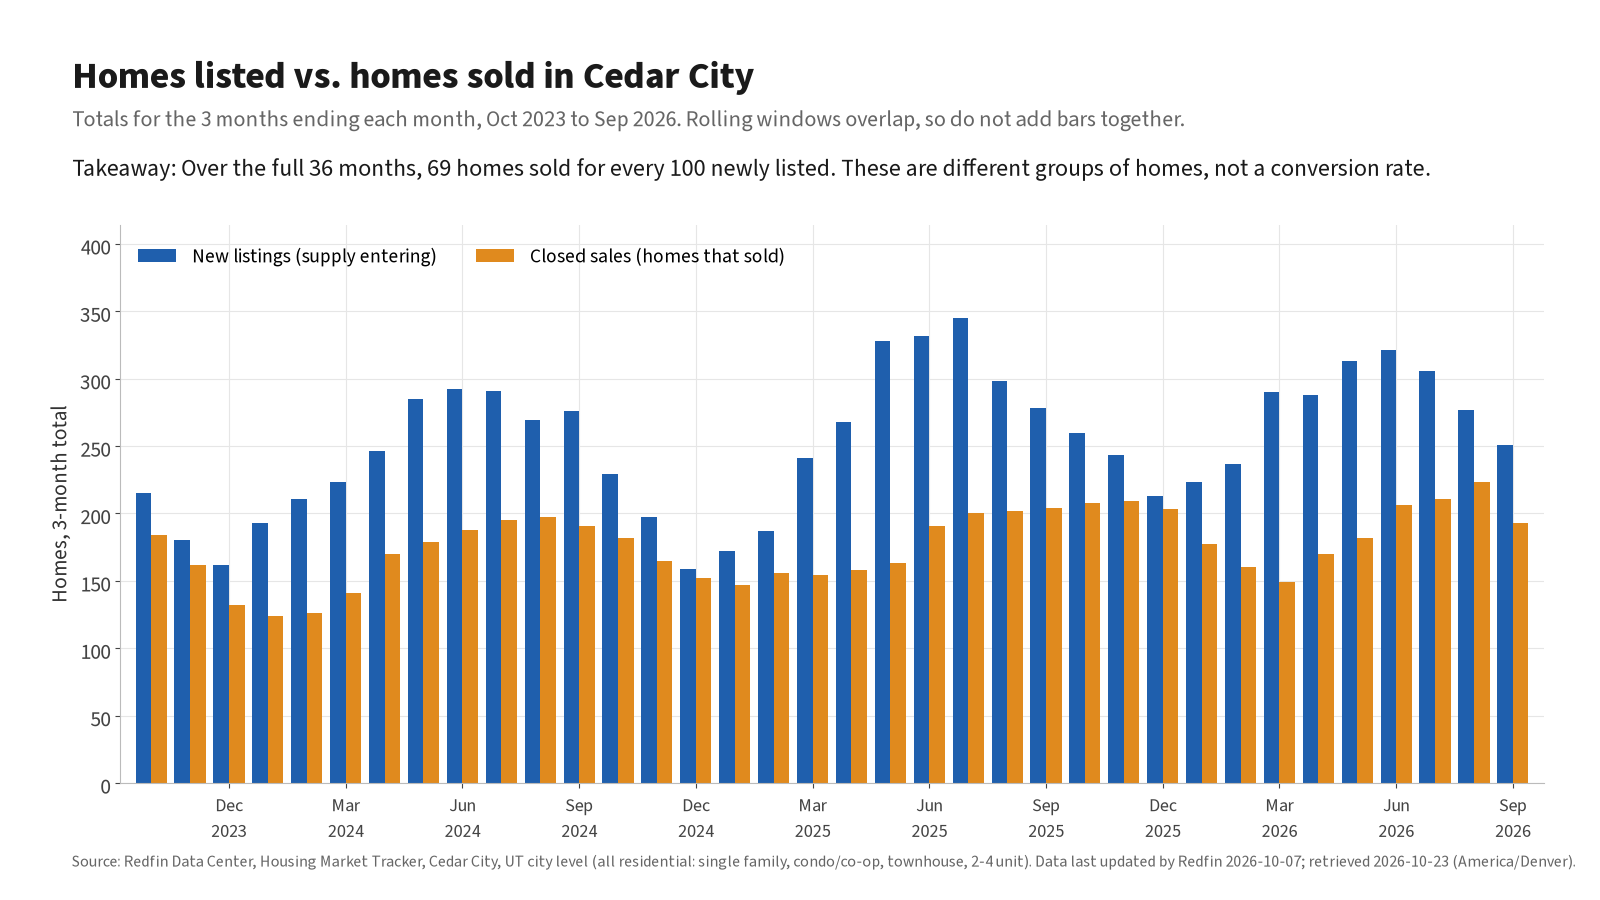
New listings and closed sales, totals for the 3 months ending each month, Cedar City, Oct 2023 to Sep 2026. Source: Redfin Data Center. Takeaway: new listings ran ahead of sales in every window. The windows overlap, so do not add the bars together.
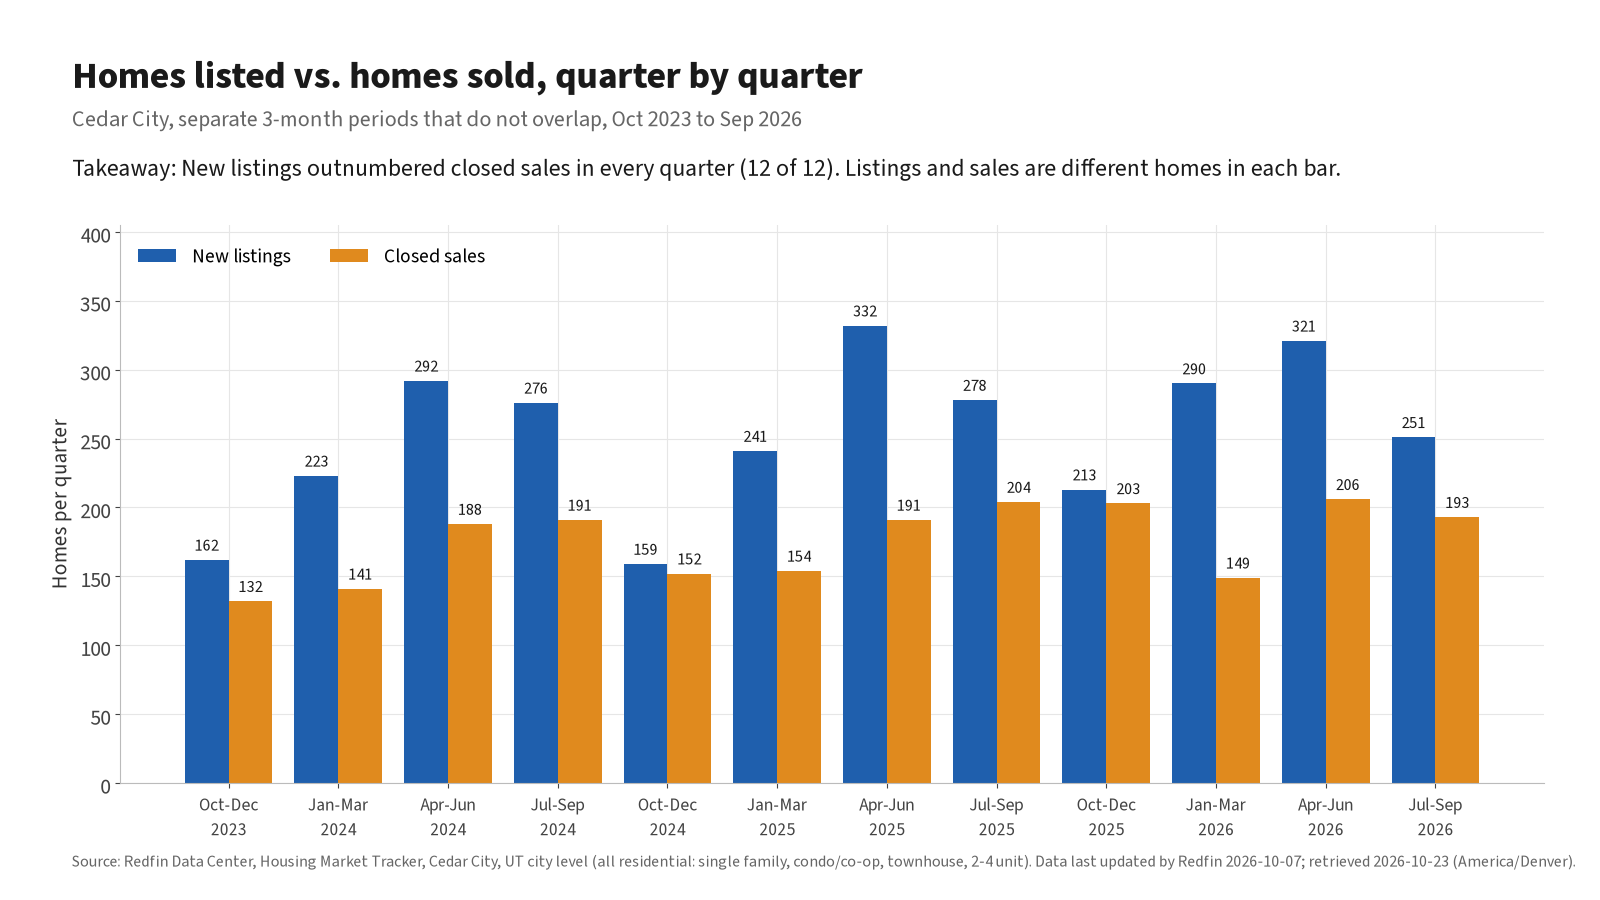
New listings and closed sales by calendar quarter (no overlap), Cedar City, Oct 2023 to Sep 2026. Source: Redfin Data Center. Takeaway: over 36 months, about 69 homes sold for every 100 newly listed.
What the numbers show: sales grew each year. So did new listings.
| 12 months | New listings | Homes sold |
|---|---|---|
| Oct 2023 - Sep 2024 | 953 | 652 |
| Oct 2024 - Sep 2025 | 1,010 | 701 |
| Oct 2025 - Sep 2026 | 1,075 | 751 |
A new listing and a sale in the same quarter are usually different homes, so 69 per 100 is not a "sell-through rate." It is a simple way to compare how much supply came in with how much closed.
4. Months of supply
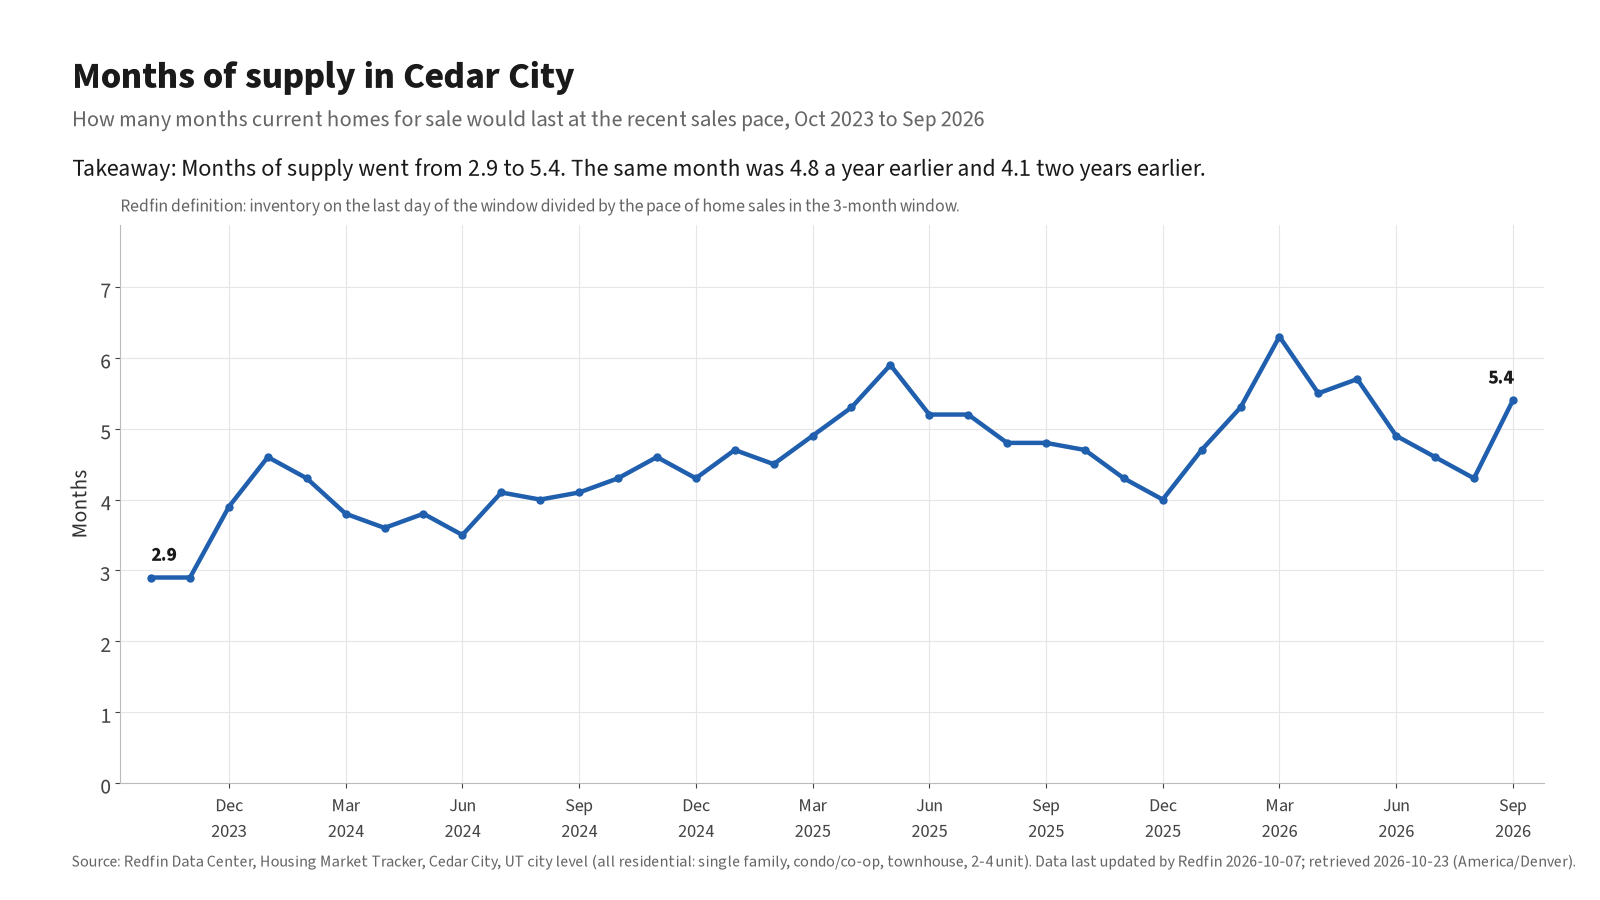
Months of supply as published by Redfin (homes for sale divided by the recent pace of sales), Cedar City, Oct 2023 to Sep 2026. Source: Redfin Data Center. Takeaway: it went from 2.9 to 5.4, with a high of 6.3 in March 2026.
What the numbers show: 5.4 months in September 2026, compared with 4.8 in September 2025 and 4.1 in September 2024. Put simply, if no new homes were listed, it would take a little over five months to sell what is on the market at the recent pace.
5. Median sale price and days on market
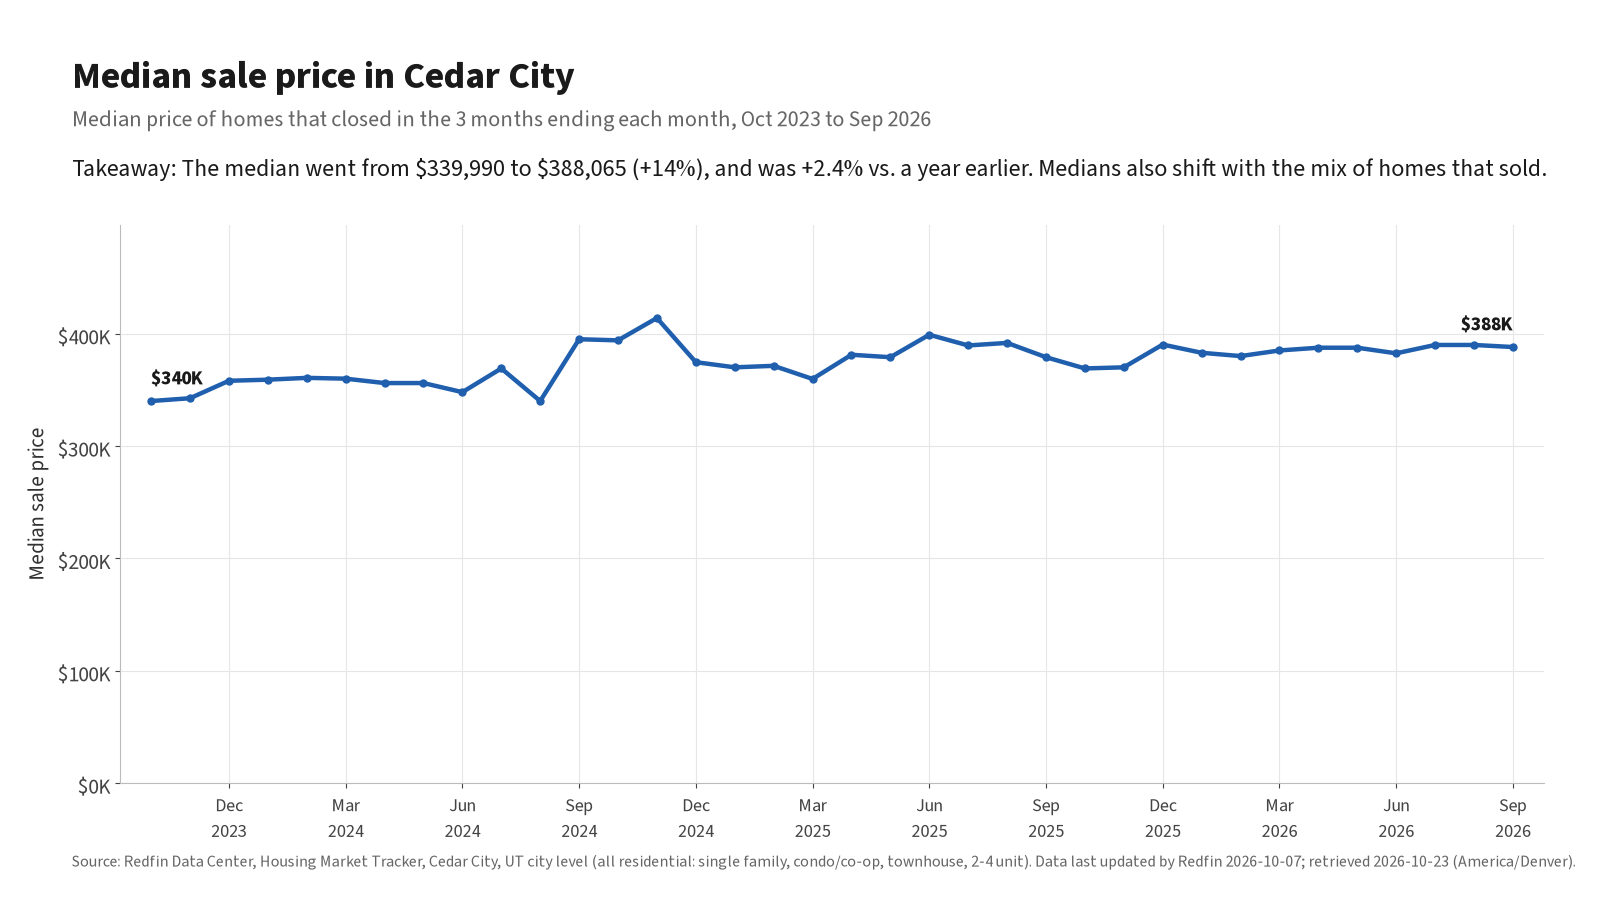
Median sale price for the 3 months ending each month, Cedar City, Oct 2023 to Sep 2026. Source: Redfin Data Center. Takeaway: $339,990 at the start, $388,065 now. Since October 2024 it has stayed between $359,645 and $413,900.
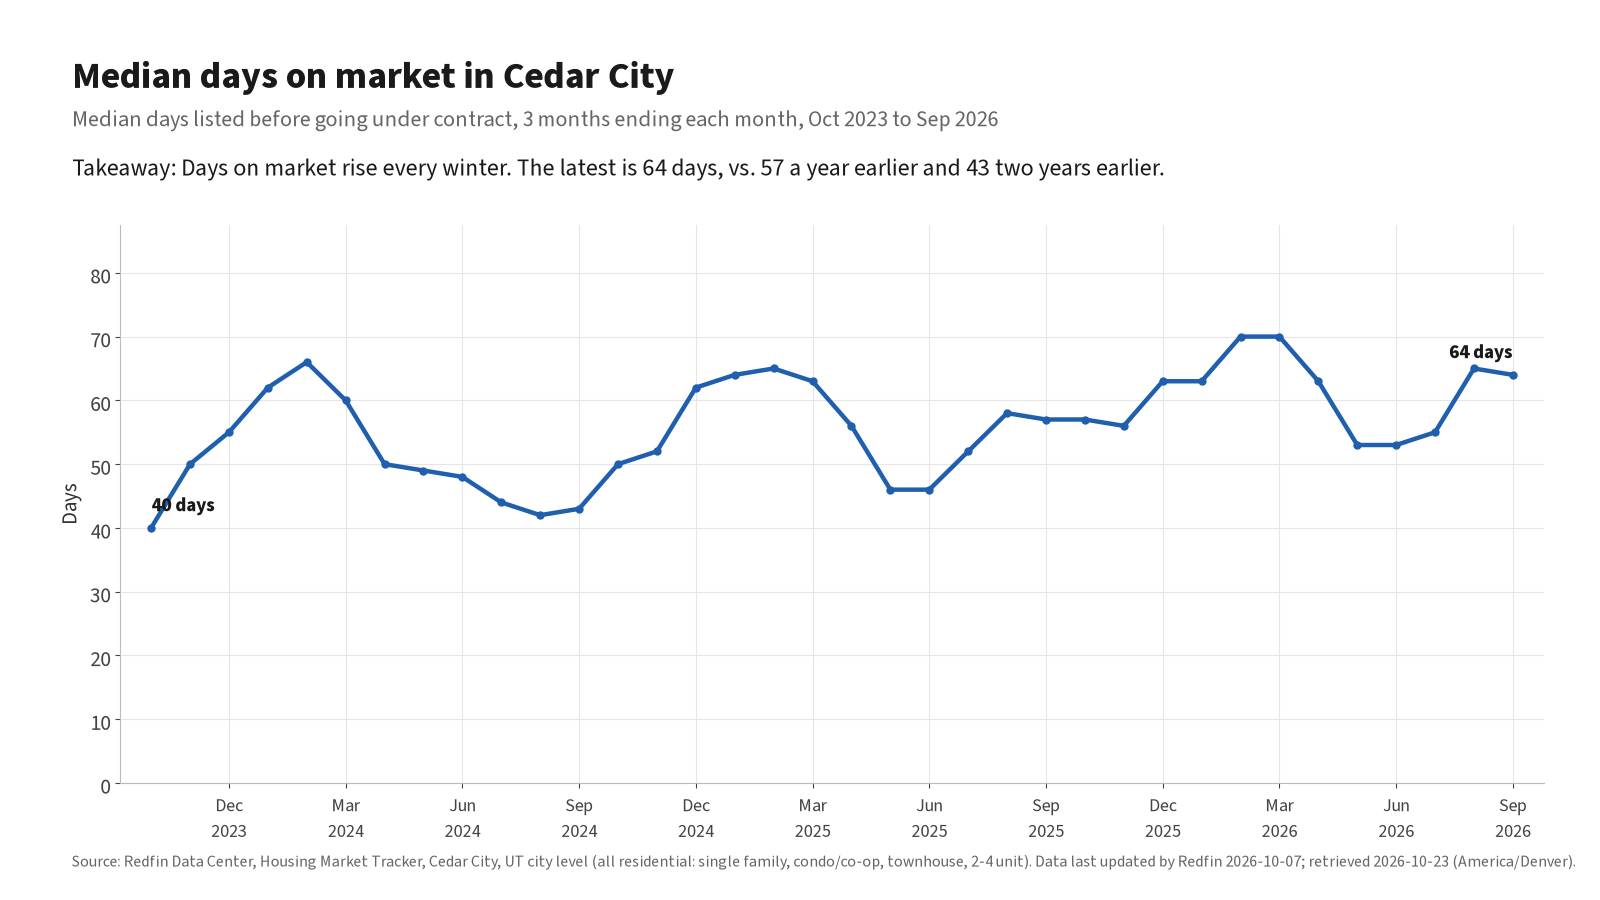
Median days on market for the 3 months ending each month, Cedar City, Oct 2023 to Sep 2026. Source: Redfin Data Center. Takeaway: homes are taking longer to go under contract, 64 days now vs. 40 at the start.
What the numbers show:
- Median sale price, Jul-Sep windows: $395,000 (2024), $379,000 (2025), $388,065 (2026). The highest 3-month median in the period was $413,900 (Sep-Nov 2024).
- Median days on market, Jul-Sep windows: 43 (2024), 57 (2025), 64 (2026). Homes that went under contract this summer took a median of 64 days to get there.
My read on it
This part is interpretation, not data.
More homes have been coming on the market than selling. Each of the last three 12-month periods brought in roughly 300 more new listings than sales. Not every unsold listing stays on the market (some are withdrawn or expire), but enough did to lift inventory through 2024 and 2025. Sales are growing too, and this year inventory has mostly leveled off.
For buyers, that means more choices and more time to decide than in 2023. For sellers, it means more competition, so price and condition matter more. The median price has been fairly flat for two years while days on market went up, which tells me well-priced homes still sell, and homes priced high wait.
I am not calling this a buyer's market or a seller's market. Inventory alone does not settle that, and a citywide median is not a comp for one house.
Limits of this data
- Sales, prices, days on market and new listings are 3-month rolling figures from Redfin, not single months.
- The data covers all residential property in the city (single family, condo/co-op, townhouse, 2-4 unit). It does not split resale from new construction or break out property types.
- Inventory is the count on the last day of each month and excludes homes on the market more than a year.
- These are Redfin's city-level numbers. My September 2026 Cedar City market check used local MLS numbers with different filters and a single month, so the figures do not match. Compare each source with itself, not with the other.
Sources and methodology
- Data: Redfin Data Center, Housing Market Tracker, monthly city file (rolling 3 months), Cedar City, UT. Data last updated by Redfin October 7, 2026. Retrieved October 23, 2026.
- Definitions: Redfin Data Center methodology.
- Range: 36 months, October 2023 through September 2026. No numbers were estimated or filled in, and no other sources were mixed in.
- The 12-month and 36-month totals add up non-overlapping calendar quarters so no month is counted twice.
Thinking about buying or selling in Cedar City?
Want a straight read for your house, not a national headline? Call or text 435-708-1937. A call or a text is fastest.
Curious what your home could sell for today? Start with a home value request. Own a short-term rental in Southern Utah? See short-term rental management.
Gerardo Lopez | Associate Broker | RE/MAX Properties | 435-708-1937
Citywide figures, not a comp for one house. Pricing depends on condition, lot and location.