HURRICANE MARKET UPDATE
Hurricane had 423 homes for sale at the end of September 2026. In October 2023 it had 223. That is up 90% in three years, close to double.
Compared with September 2025, inventory is up about 4%. It peaked at 438 in May 2026, dropped to 316 in June, and was back to 423 by September. That June drop needs a closer look, and I cover it below.
This post walks through 36 months of city-level numbers from the Redfin Data Center: homes for sale, new listings, sales, months of supply, median price and days on market. What the numbers show comes first. What I think they mean comes after, labeled as my read. I did the same for Cedar City in my Cedar City 36-month update.
The short version
- Homes for sale: 223 (Oct 2023) to 423 (Sep 2026), up 90%. Up 4% from Sep 2025 (405) and up 36% from Sep 2024 (311). Peak of 438 in May 2026.
- June 2026 step: 438 in May to 316 in June, with no matching change in listings or sales. See section 2.
- Listings vs. sales: 2,916 new listings and 922 sales over the 36 months. About 32 sales for every 100 new listings.
- Months of supply: 8.9 (Oct 2023) to 17.7 (Sep 2026), the highest reading in the 36 months.
- Median sale price: $519,000 (Aug-Oct 2023) to $514,705 (Jul-Sep 2026). Down 8.9% from $564,900 a year earlier.
- Median days on market: 61 (Aug-Oct 2023). 48 in Jul-Sep 2026, vs. 80 a year earlier.
1. Homes for sale, month by month
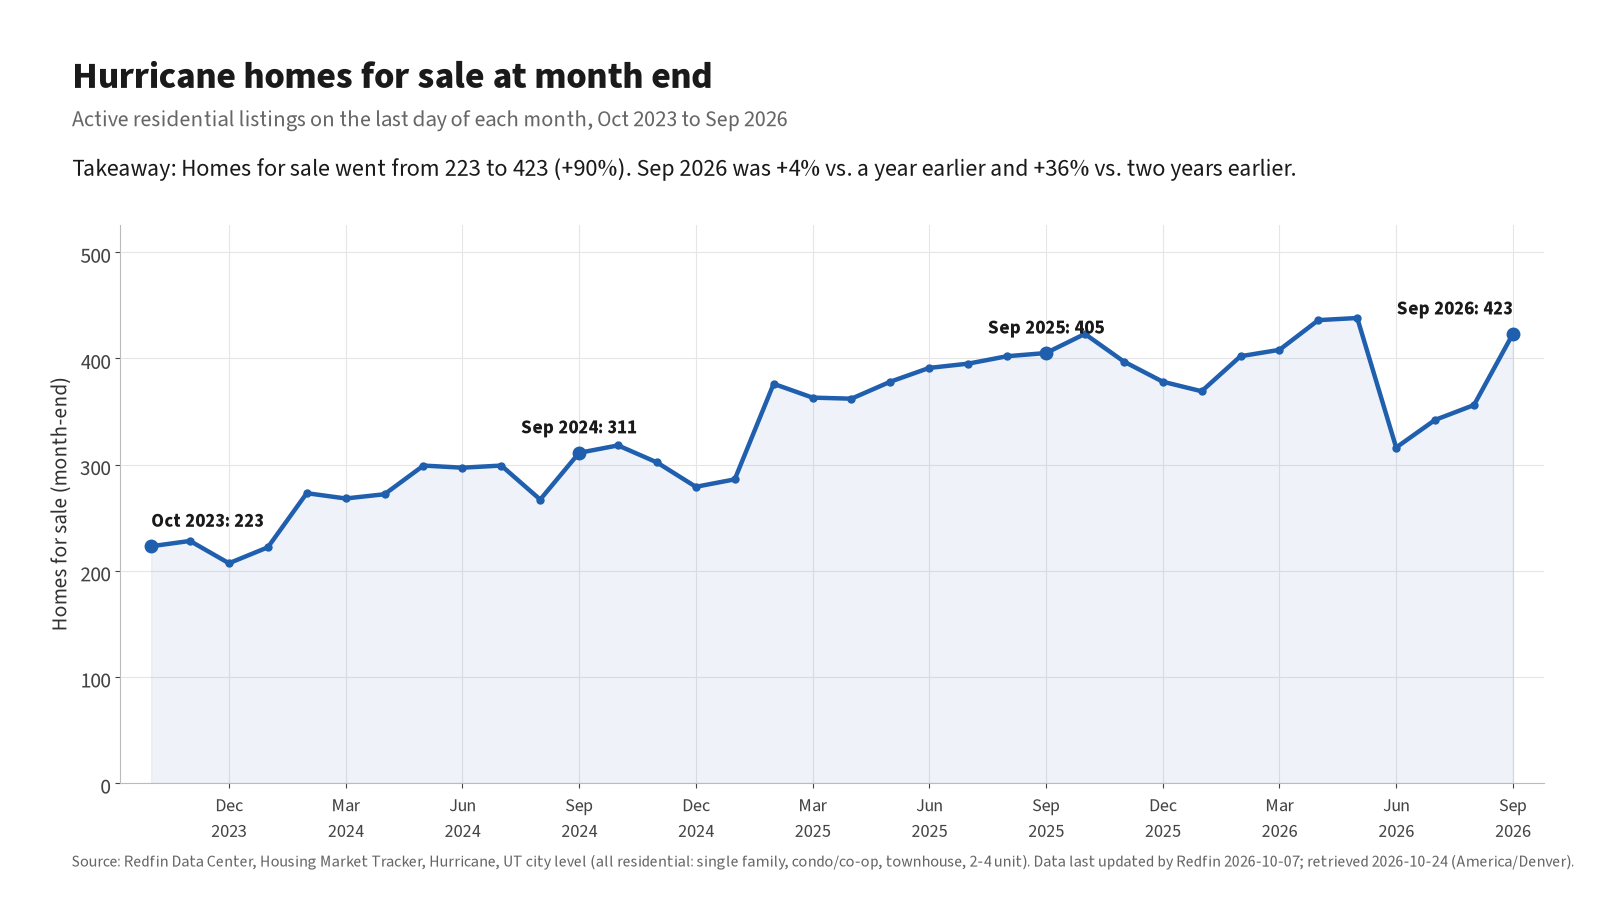
Homes for sale on the last day of each month, Hurricane, Oct 2023 to Sep 2026. Source: Redfin Data Center. Takeaway: inventory roughly doubled over three years, with a sharp one-month drop in June 2026 that reversed by September.
What the numbers show: the low point was 207 homes in December 2023. The high point was 438 in May 2026. September 2026 landed at 423.
2. Same month, different year, and the June 2026 step
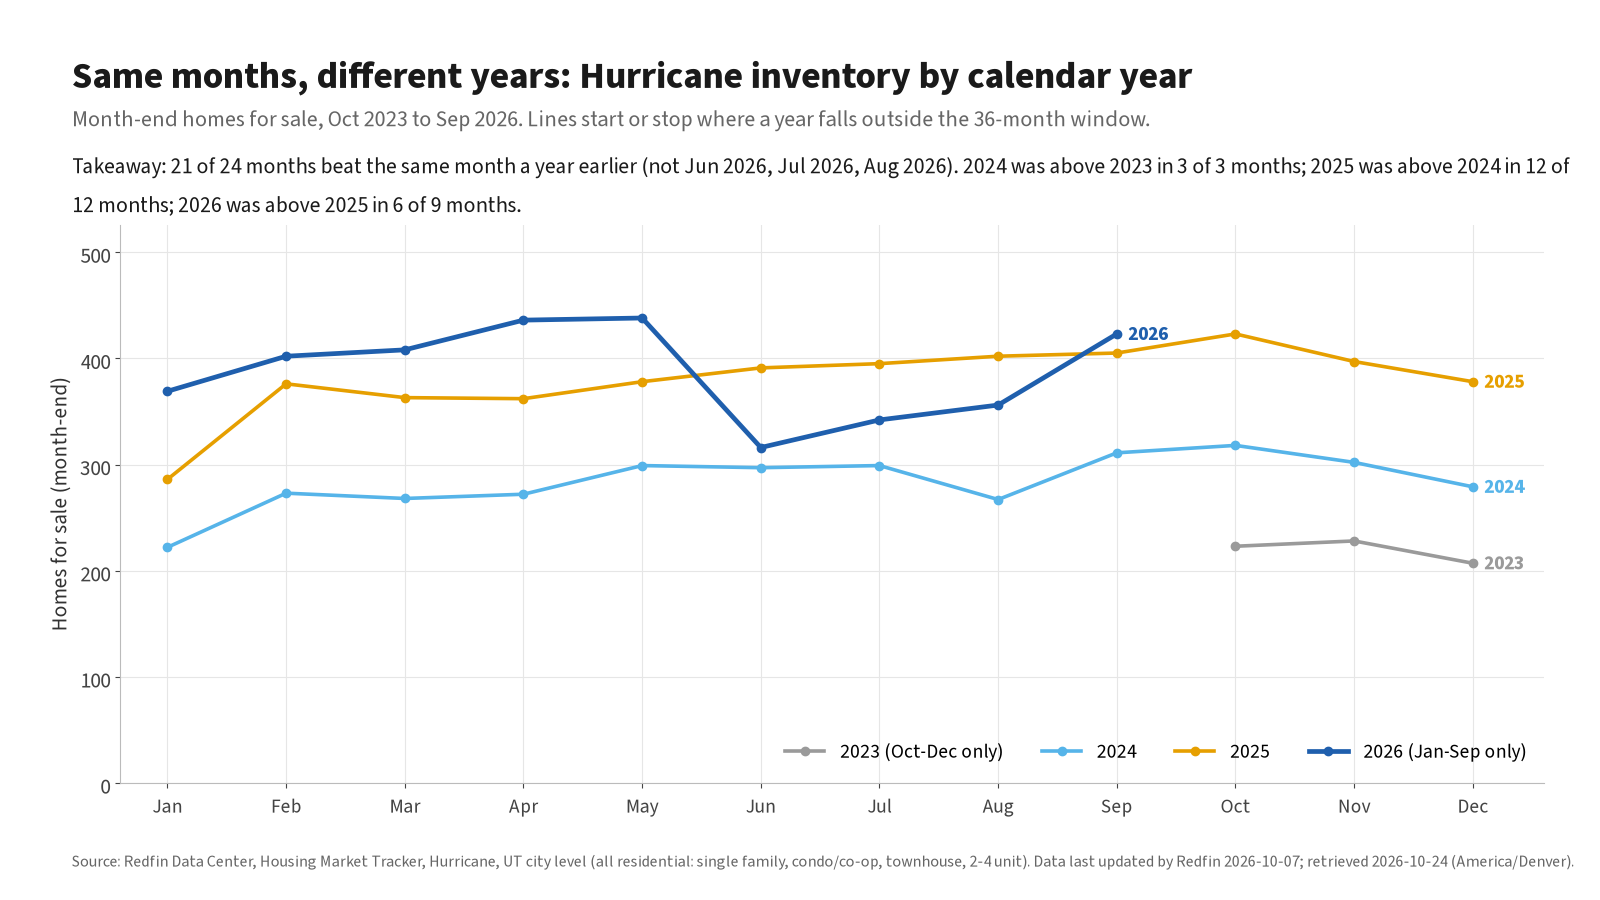
Month-end homes for sale by calendar year, Hurricane, Oct 2023 to Sep 2026. Source: Redfin Data Center. Takeaway: 2025 ran above 2024 every month, and 2026 ran above 2025 in 6 of 9 months.
What the numbers show: in 21 of the last 24 months, inventory was higher than the same month a year earlier. The three exceptions were June, July and August 2026.
Those three months trace back to one step. Inventory went from 438 at the end of May to 316 at the end of June, a drop of 122 homes in one month. Over the same period the numbers around it did not change much:
- New listings (3-month total): 296 for the window ending May, 282 ending June.
- Homes sold (3-month total): 85 ending May, 91 ending June.
- Pending sales (3-month total): 175 ending May, 173 ending June.
Redfin does not give a reason for the drop. Inventory then climbed back to 342 in July, 356 in August and 423 in September. There was a similar one-month jump the other way in February 2025, from 286 to 376.
Do not read the June 2026 drop as a real decline in homes for sale without checking the MLS. A change like this can come from how listings are counted or reported, and I cannot tell from this data which it was. It is a reason to treat any single month of Hurricane inventory with some caution.
3. New listings vs. homes sold
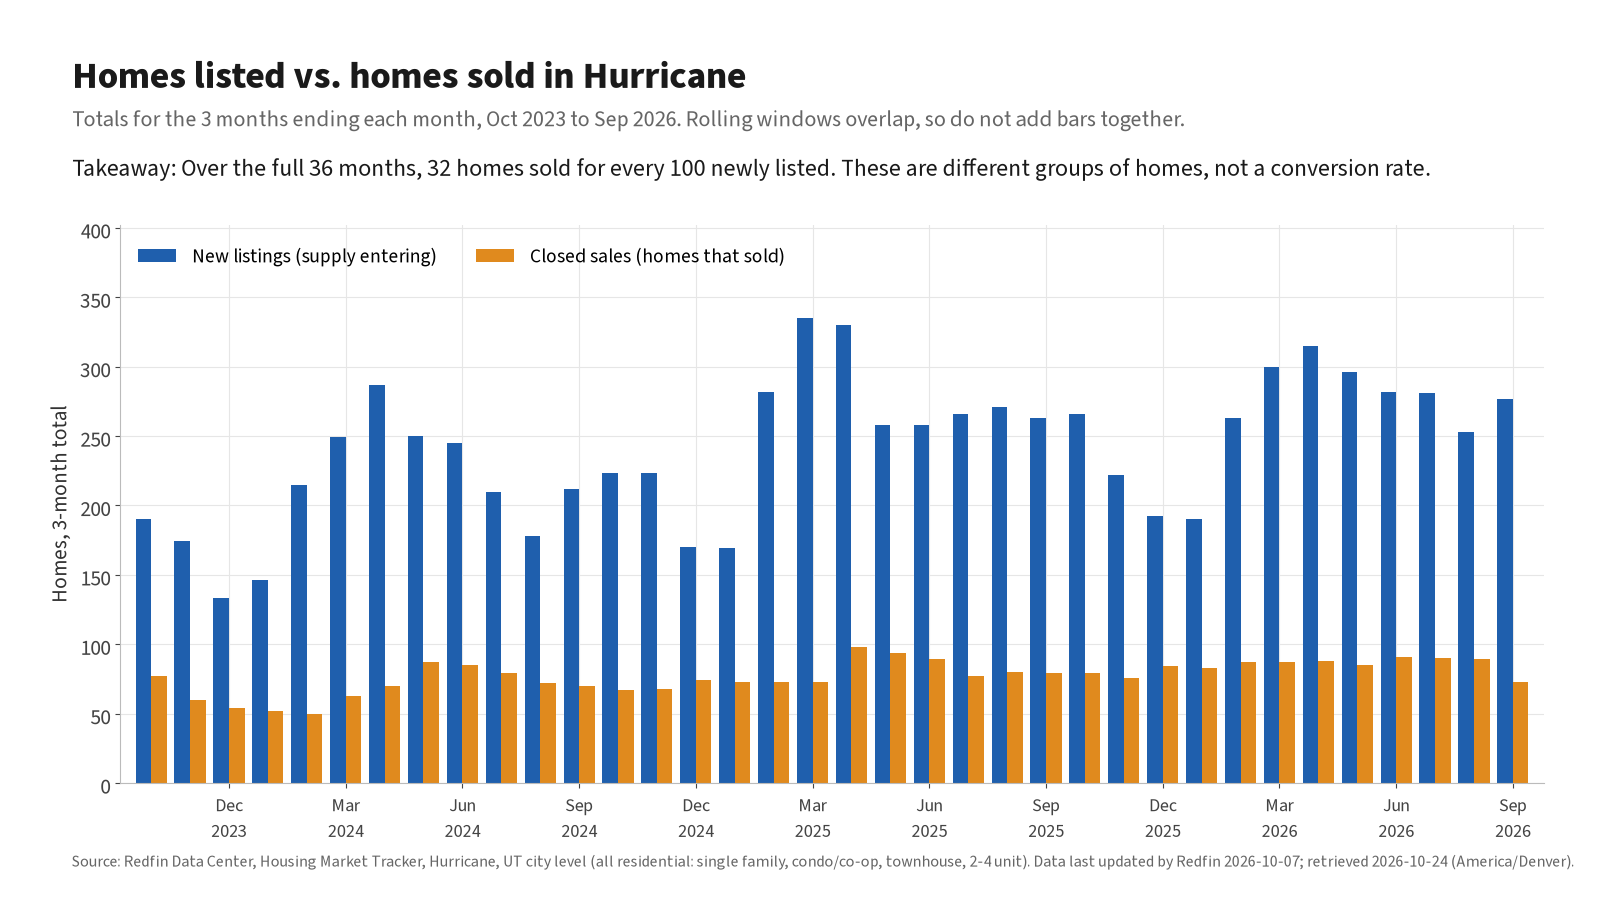
New listings and closed sales, totals for the 3 months ending each month, Hurricane, Oct 2023 to Sep 2026. Source: Redfin Data Center. Takeaway: new listings ran well ahead of sales in every window. The windows overlap, so do not add the bars together.
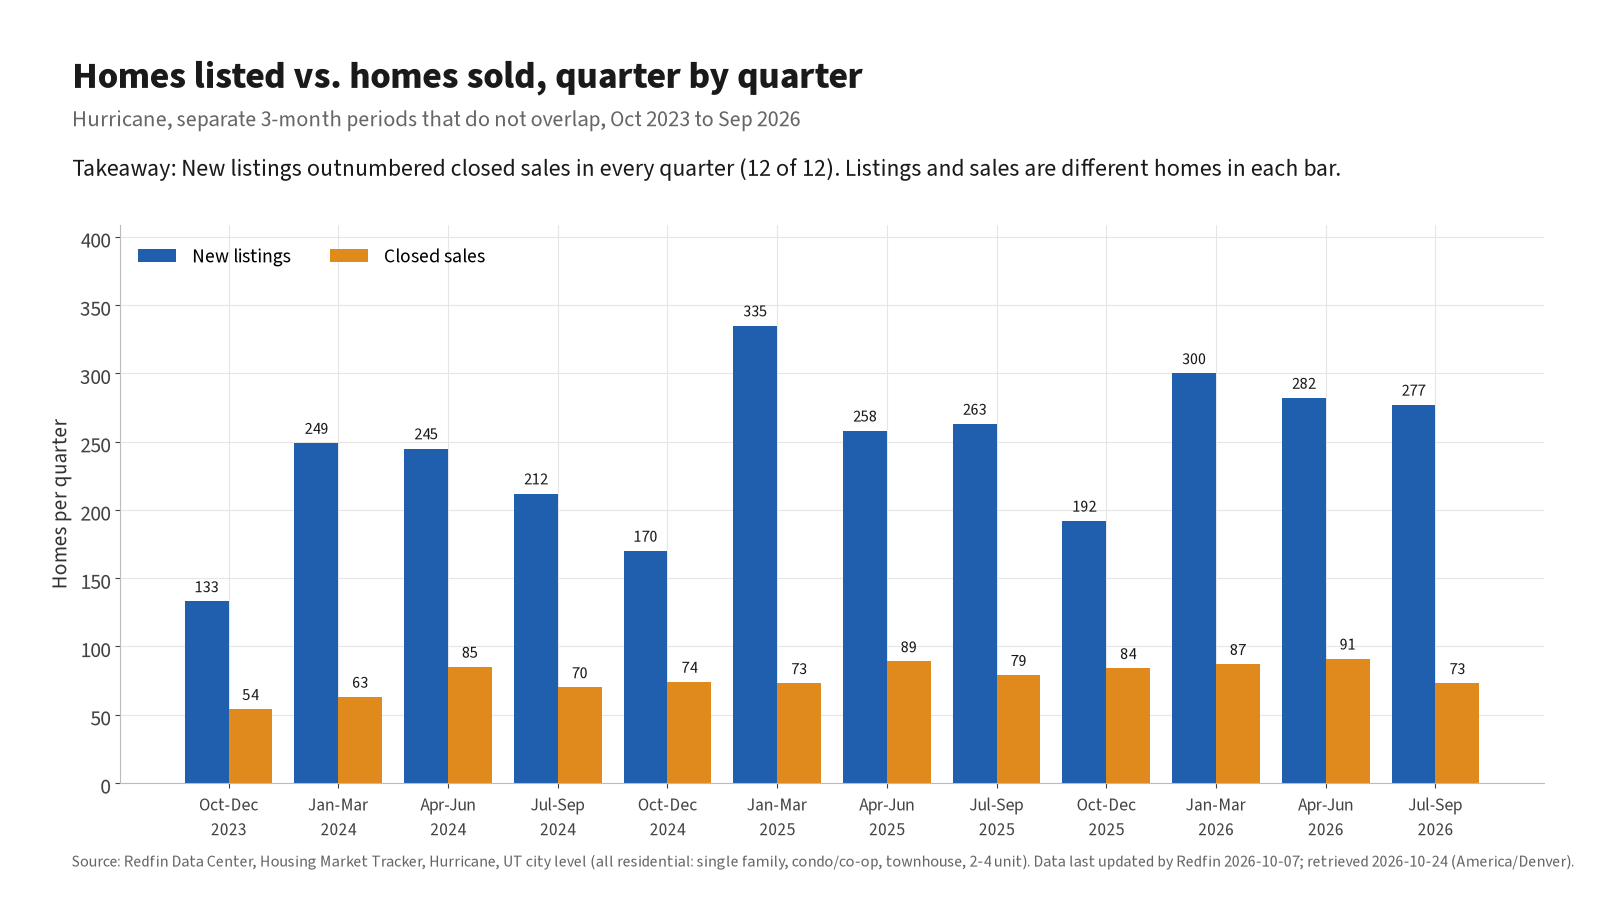
New listings and closed sales by calendar quarter (no overlap), Hurricane, Oct 2023 to Sep 2026. Source: Redfin Data Center. Takeaway: over 36 months, about 32 homes sold for every 100 newly listed.
What the numbers show: new listings and sales both grew each year, but listings grew faster.
| 12 months | New listings | Homes sold |
|---|---|---|
| Oct 2023 - Sep 2024 | 839 | 272 |
| Oct 2024 - Sep 2025 | 1,026 | 315 |
| Oct 2025 - Sep 2026 | 1,051 | 335 |
The latest quarter (Jul-Sep 2026) had 277 new listings and 73 sales. A year earlier it was 263 and 79. A new listing and a sale in the same quarter are usually different homes, so 32 per 100 is not a "sell-through rate." It is a simple way to compare how much supply came in with how much closed. The gap is much wider than in Cedar City, where it was about 69 per 100 over the same 36 months.
4. Months of supply
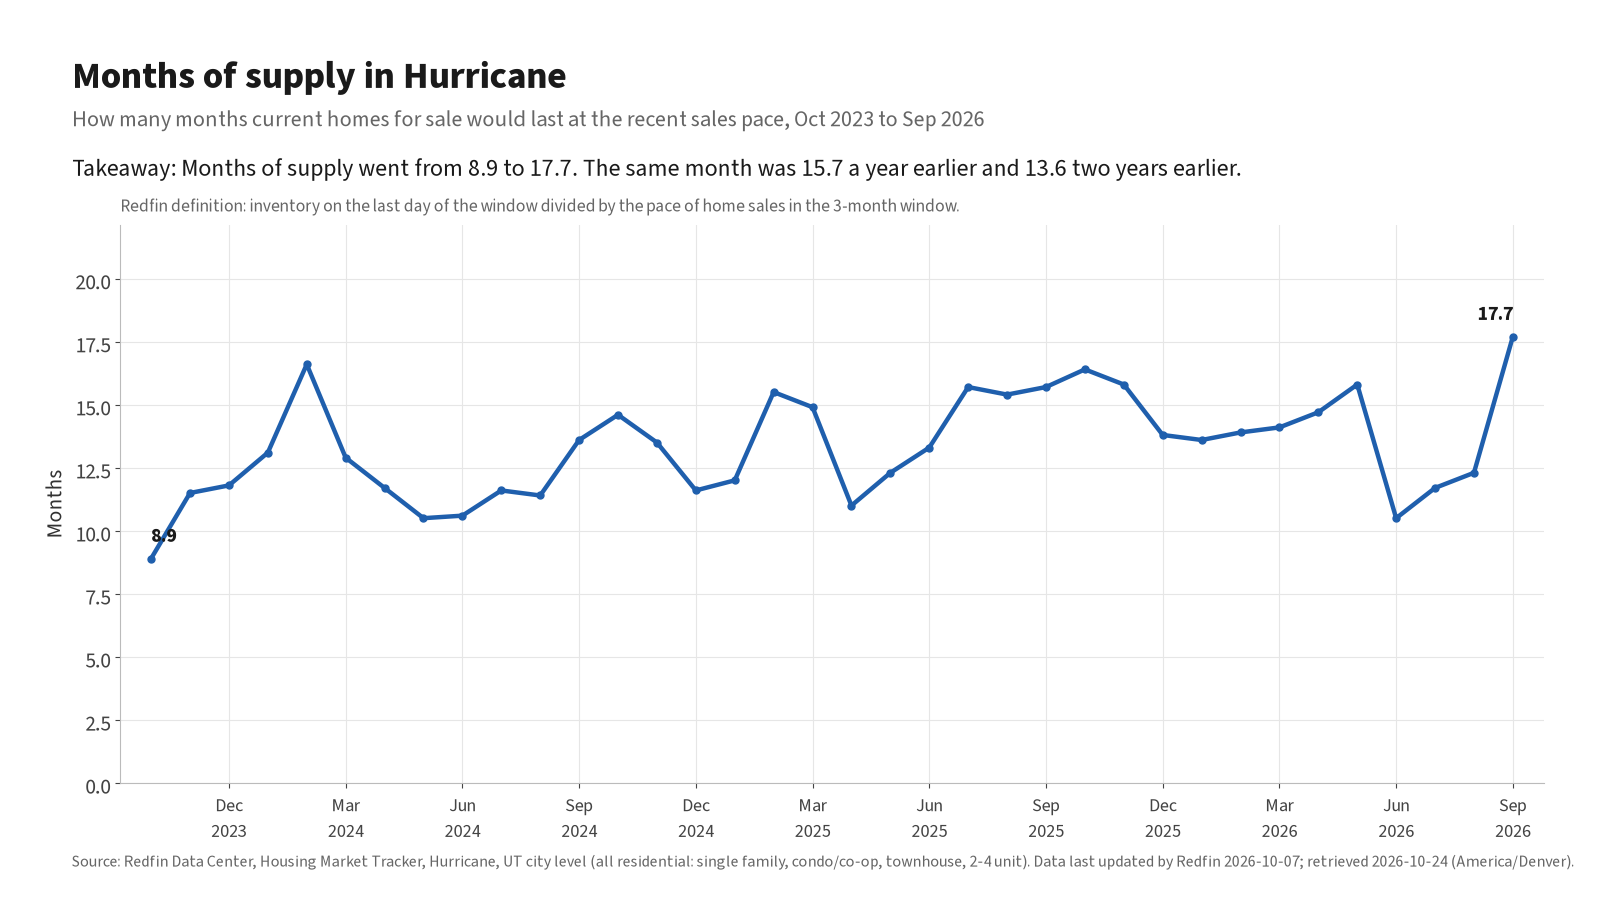
Months of supply as published by Redfin (homes for sale divided by the recent pace of sales), Hurricane, Oct 2023 to Sep 2026. Source: Redfin Data Center. Takeaway: it went from 8.9 to 17.7, and it swings a lot from month to month.
What the numbers show: 17.7 months in September 2026, compared with 15.7 in September 2025 and 13.6 in September 2024. Put simply, if no new homes were listed, it would take about a year and a half to sell what is on the market at the recent pace. It dropped to 10.5 in June 2026, the month of the inventory step, then rose again.
This number depends on a small base of sales. Hurricane had 73 closed sales in the Jul-Sep 2026 window, so a handful of sales moves it noticeably.
5. Median sale price and days on market
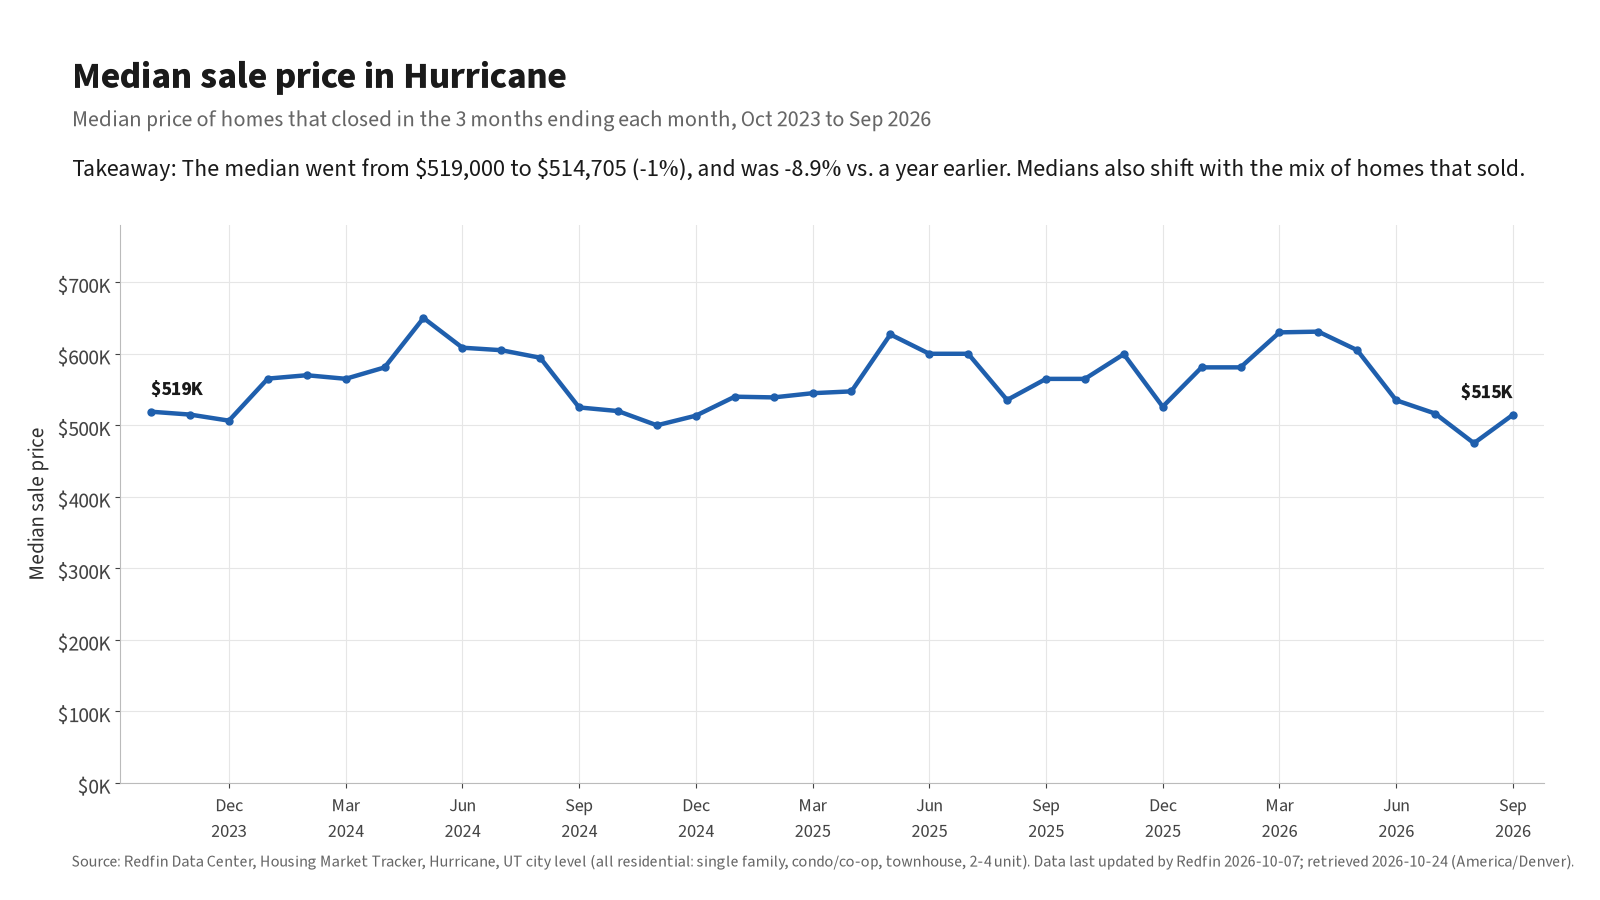
Median sale price for the 3 months ending each month, Hurricane, Oct 2023 to Sep 2026. Source: Redfin Data Center. Takeaway: $519,000 at the start, $514,705 now, with a lot of up and down in between. Medians also shift with the mix of homes that sold.
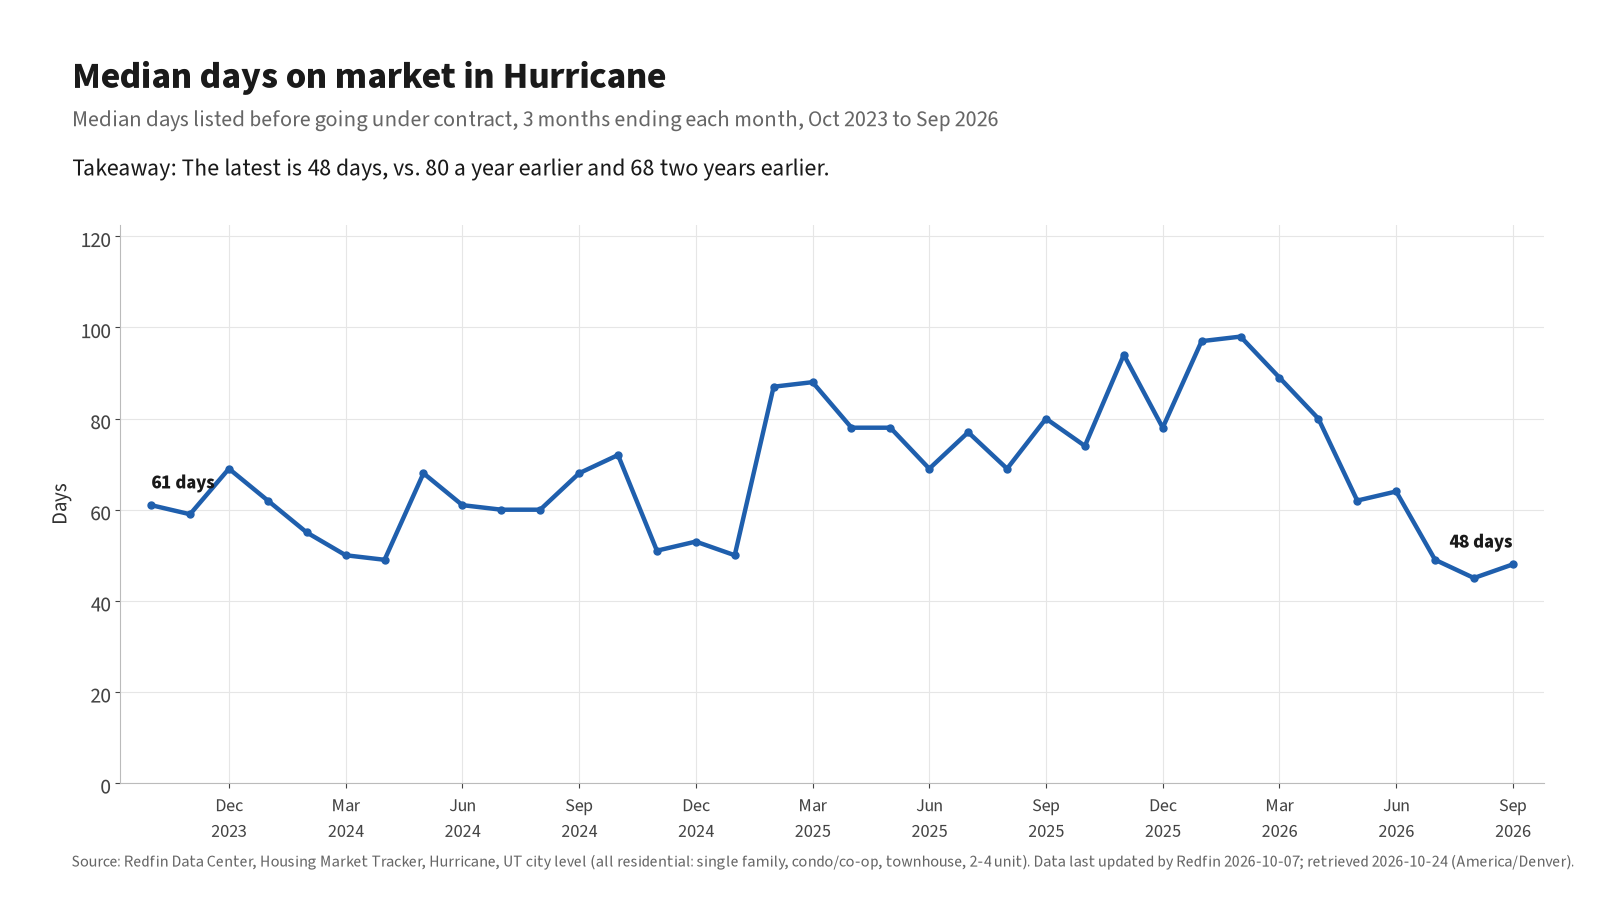
Median days on market for the 3 months ending each month, Hurricane, Oct 2023 to Sep 2026. Source: Redfin Data Center. Takeaway: days on market peaked near 98 days in early 2026 and came down to 48 by September.
What the numbers show:
- Median sale price, Jul-Sep windows: $525,000 (2024), $564,900 (2025), $514,705 (2026). That is down 8.9% from last year and down 2.0% from two years ago. Since October 2024 the 3-month median has ranged from $475,000 (Jun-Aug 2026) to $630,950 (Feb-Apr 2026).
- Median days on market, Jul-Sep windows: 68 (2024), 80 (2025), 48 (2026). Homes that went under contract this summer took a median of 48 days to get there. The highest reading was 98 days (Dec 2025-Feb 2026) and the lowest was 45 (Jun-Aug 2026).
My read on it
This part is interpretation, not data.
Hurricane has had far more homes listed than sold for three years running, and the pile of homes for sale has grown with it. Redfin's months of supply is high for that reason. What I would not do is read the June 2026 step as the market changing. It looks like a reporting change, and the September number is back in line with the trend.
The price and speed numbers point in different directions. The summer median price is lower than last summer, but homes that sold this summer went under contract faster. A median from about 73 sales can move because a different mix of homes sold, such as more or fewer homes in a higher price range, so I would not take a single window as a trend. I would watch whether the next few windows keep the same pattern.
For buyers, there are a lot of homes to compare. For sellers, a lot of homes means competition, so price and condition matter. I am not calling this a buyer's market or a seller's market. Inventory alone does not settle that, and a citywide median is not a comp for one house.
Limits of this data
- Sales, prices, days on market and new listings are 3-month rolling figures from Redfin, not single months.
- The data covers all residential property in the city (single family, condo/co-op, townhouse, 2-4 unit). It does not split resale from new construction or break out property types, price ranges or neighborhoods.
- Inventory is the count on the last day of each month and excludes homes on the market more than a year.
- The June 2026 inventory step has no explanation in the data. Check the MLS before relying on any single month.
- Sales counts are small (about 73 to 91 per 3-month window recently), so medians and months of supply can swing.
- These are Redfin's city-level numbers. My September 2026 Cedar City market check used local MLS numbers for a different city, a single month and different filters, so it does not compare directly. Compare each source with itself, not with the other.
Sources and methodology
- Data: Redfin Data Center, Housing Market Tracker, monthly city file (rolling 3 months), Hurricane, UT. Data last updated by Redfin October 7, 2026. Retrieved October 24, 2026.
- Definitions: Redfin Data Center methodology.
- Range: 36 months, October 2023 through September 2026. No numbers were estimated or filled in, and no other sources were mixed in.
- The 12-month and 36-month totals add up non-overlapping calendar quarters so no month is counted twice.
Thinking about buying or selling in Hurricane?
Want a straight read for your house, not a national headline? Call or text 435-708-1937. A call or a text is fastest.
Curious what your home could sell for today? Start with a home value request. Own a short-term rental in Southern Utah? See short-term rental management.
Gerardo Lopez | Associate Broker | RE/MAX Properties | 435-708-1937
Citywide figures, not a comp for one house. Pricing depends on condition, lot and location.